Dashboard & reports
QA analytics live in two places: the Dashboard for a glanceable overview, and dedicated report pages for drill-down. Most of the dashboard's compact cards link to the corresponding full report, carrying your filters forward as query params.
Dashboard
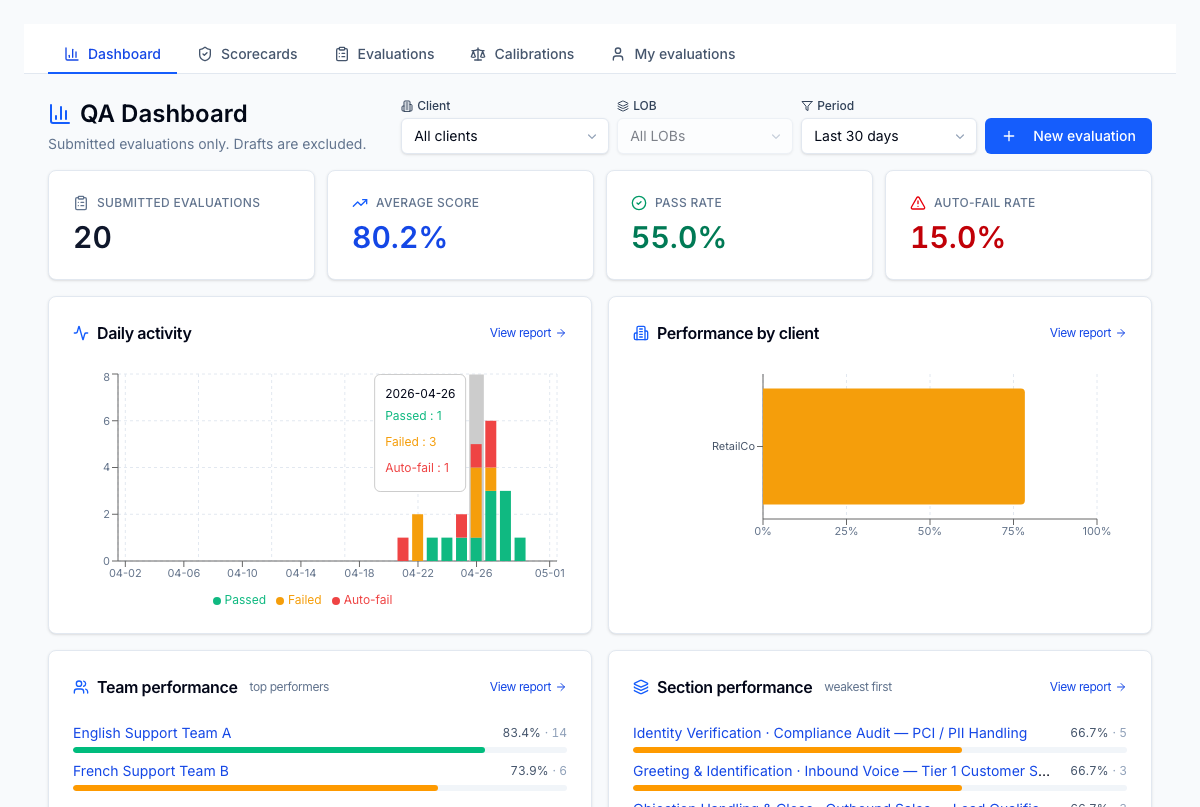
The /qa/dashboard page surfaces:
- Four KPI cards — submitted count, average score %, pass rate %, and auto-fail rate %. Each shows the trend vs. the prior period.
- Cascading filters — client → LOB (LOB options narrow to the selected client) and a period selector (7 / 30 / 90 days).
- Daily activity chart — stacked bar by day with passed / failed / auto-fail segments.
- Performance breakdown chart — horizontal bars by client (when no client filter is set) or by LOB (when a client is selected).
- Team performance card — top 5 teams ranked by average score; link to the full report.
- Section performance card — 5 weakest sections (coaching priorities); link to the full report.
- Top-5 agent leaderboard — rank, evaluation count, average score %, pass rate %.
- Recent submissions — last 10 evaluations with deep links to the detail page.
Filter values you set on the dashboard are forwarded to the report pages when you click through, so the drill-down always starts in the same scope you were just looking at.
Reports
Five dedicated report pages live under /qa/reports/. Each has the same set
of filters in the toolbar (period, client, LOB, scorecard) plus its own
specific controls. All five support CSV export of the underlying table.
Daily activity
/qa/reports/daily-activity
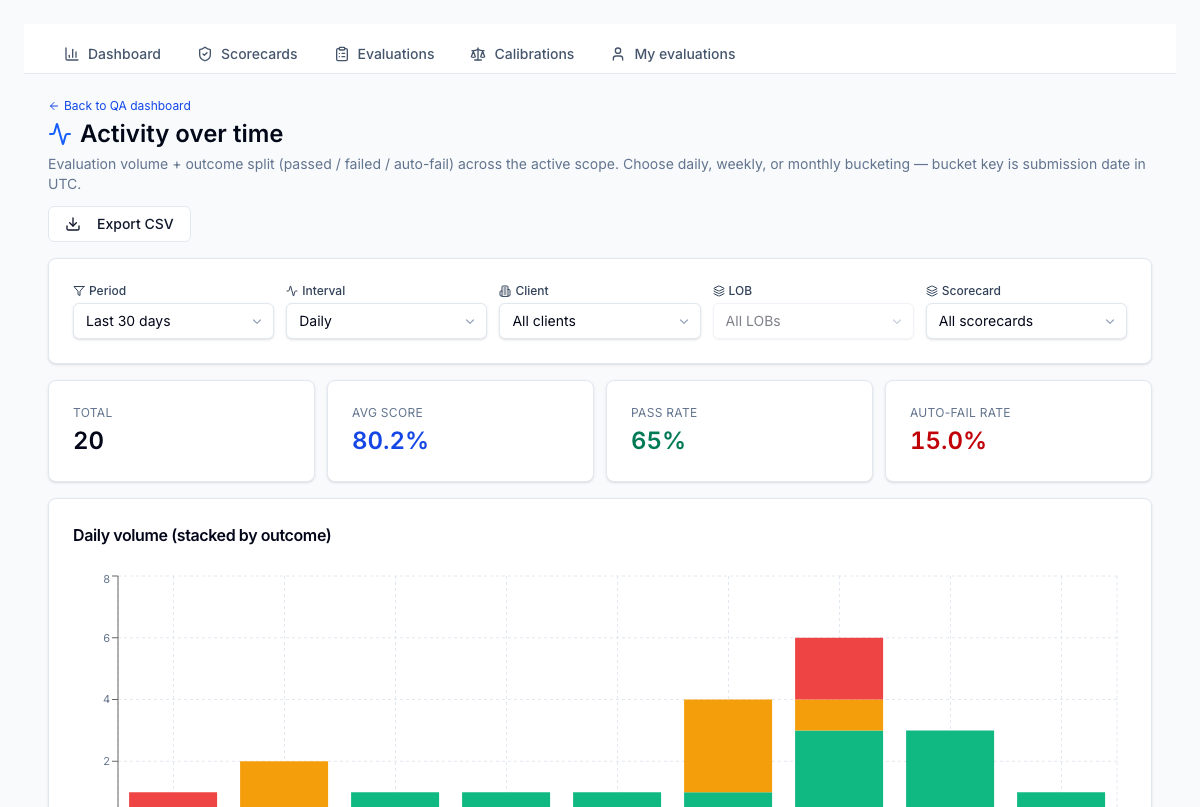
Stacked bar of evaluation activity over time, plus a detail table with average score and pass-rate per bucket. Granularity selector switches between day, week, and month — useful for spotting trends across multiple time horizons without changing the period filter.
Agent performance
/qa/reports/agent-performance
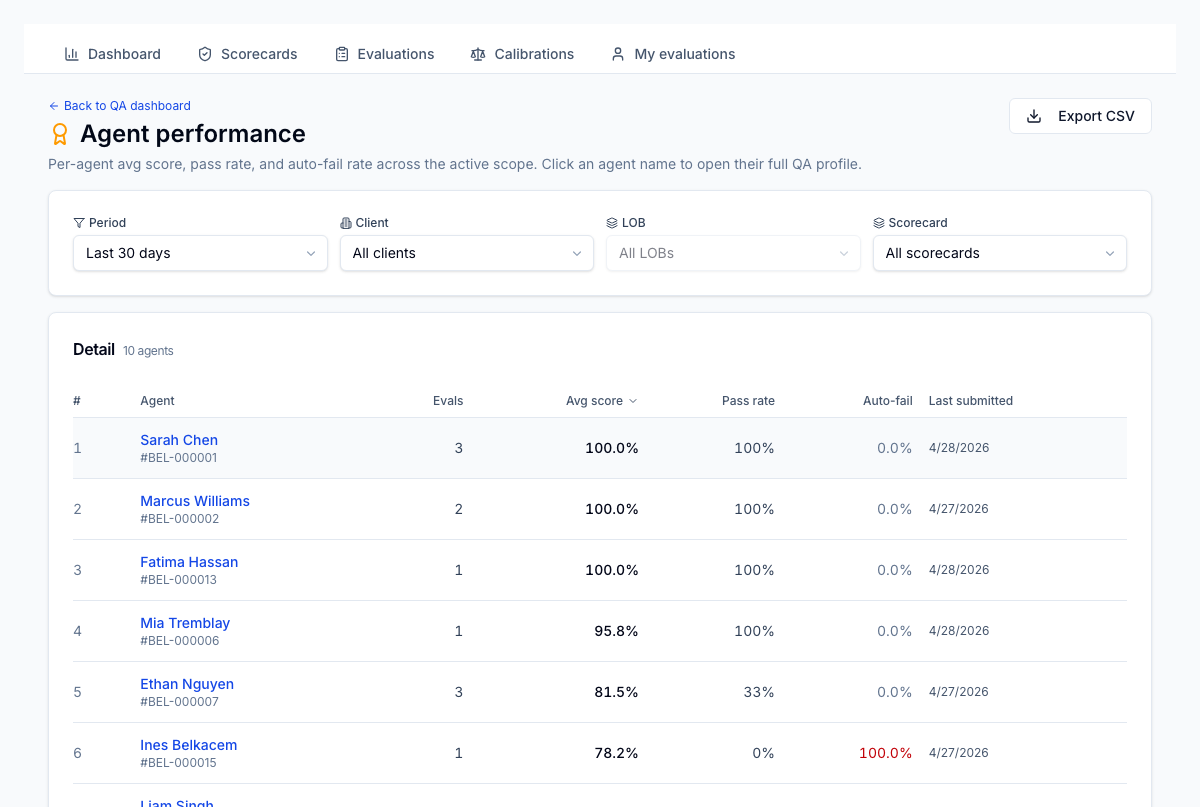
Sortable table of agents within scope: rank, name, evaluation count, average
score %, pass rate %, auto-fail rate. Sort by any column. Each agent row
links to that agent's full QA profile (/qa/agents/[id]) — the manager-side
counterpart to the agent self-view.
Team performance
/qa/reports/team-performance
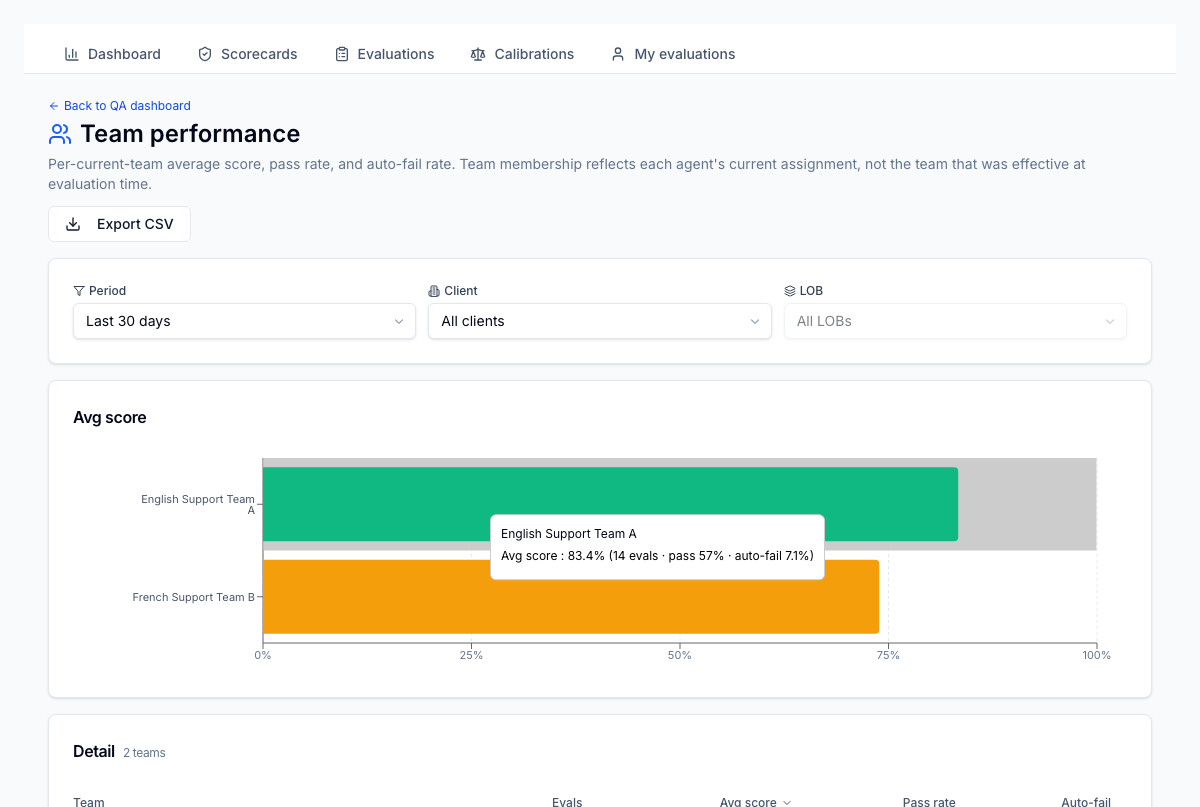
Ranked-highest-first horizontal bars per team, with eval count, avg score, pass rate, and auto-fail rate. Team membership is the agent's current team (from employee team history), so an agent who moved teams mid-period is counted under their team today, not the team they were on at the time of the evaluation. A muted "unassigned" bucket holds evaluations of agents with no current team.
Section performance
/qa/reports/section-performance
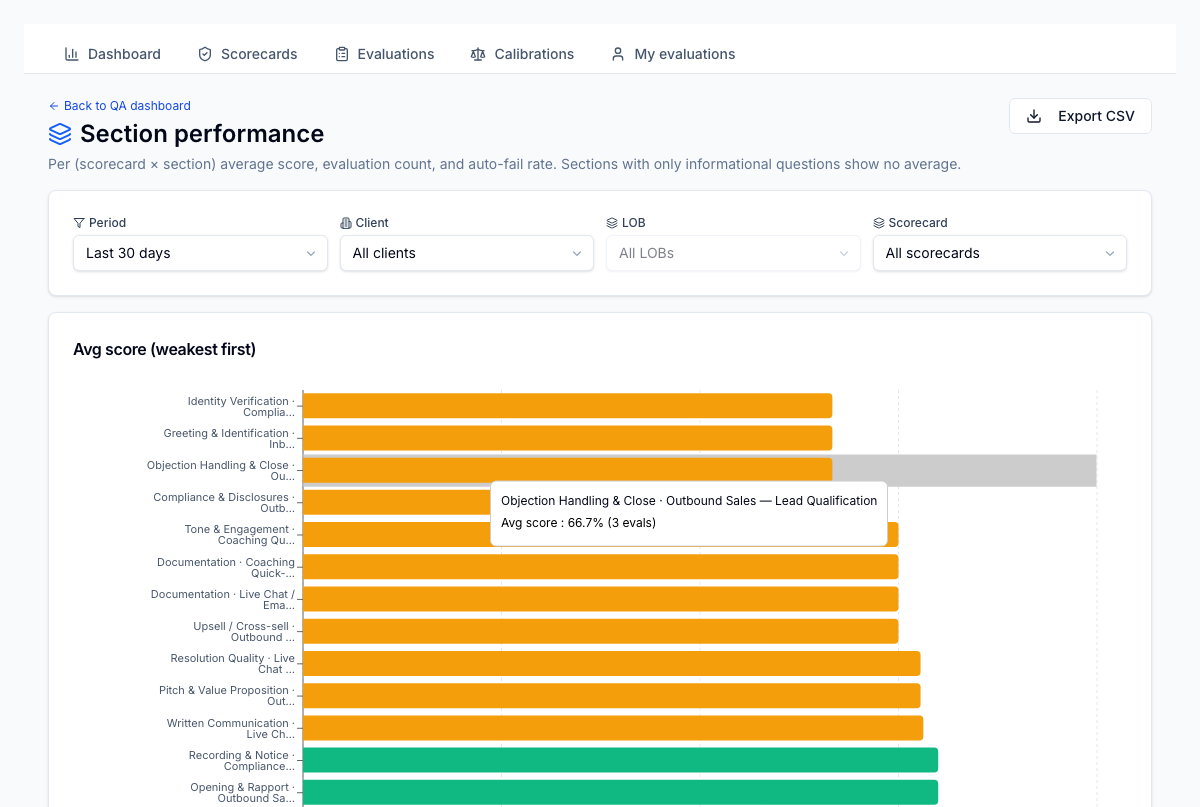
Sorted weakest-first — the sections at the top are the highest-leverage coaching priorities. When the filter scope spans multiple scorecards, rows are labelled "Section · Scorecard" so you can tell apart sections with the same name across templates.
Client / LOB performance
/qa/reports/client-performance
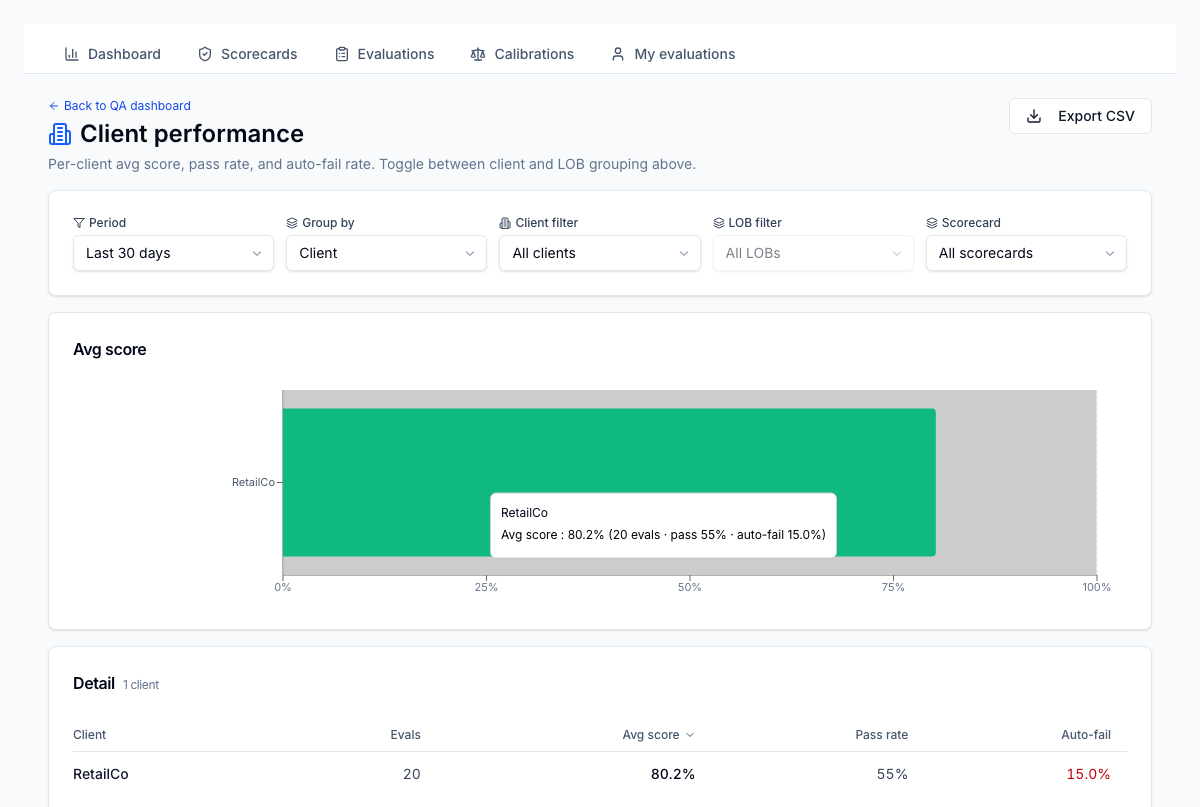
Has a Group by toggle: Client rolls up across all LOBs for that client; LOB breaks out (client, LOB) pairs separately. Useful for spotting one weak LOB inside an otherwise-healthy client account.
How aggregation works
All report pages aggregate server-side through dedicated reporting endpoints — the dashboard's compact cards do client-side aggregation over a limited list call, which is fine for the at-a-glance view but not authoritative for tenants with high evaluation volume. Always cross-check from the dedicated report when the numbers matter (board reviews, client reporting, 1:1s).